
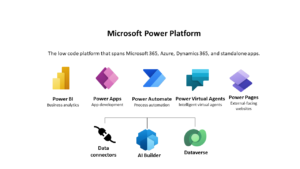
In today’s blog we will talk about one of the main components of Microsoft Power Platform , Power BI.
1) What is Power BI ?
Microsoft Power BI is a business intelligence platform that provides nontechnical business users with tools for aggregating, analyzing, visualizing and sharing data. Power BI’s user interface is fairly intuitive for users familiar with Excel and its deep integration with other Microsoft products makes it a very versatile self-service tool that requires little upfront training.
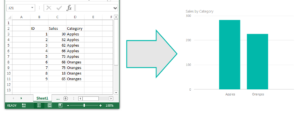
As you see above, we have some sales data in an excel sheet. Using this data, Power BI helps you build different charts and graphs to visualize the data.
A free version of Power BI is intended for small to midsize business owners; a professional version called Power BI Plus is available for a monthly subscription fee. Users can download an application for Windows 10, called Power BI Desktop, and native mobile apps for Windows, Android and iOS devices. There is also Power BI Report Server for companies that must maintain their data and reports on premises. That version of Power BI requires a special version of the desktop app — aptly called Power BI Desktop for Power BI Report Server.
2) Common uses of Power BI ?
Microsoft Power BI is used to find insights within an organization’s data. Power BI can help connect disparate data sets, transform and clean the data into a data model and create charts or graphs to provide visuals of the data. All of this can be shared with other Power BI users within the organization.
The data models created from Power BI can be used in several ways for organizations, including telling stories through charts and data visualizations and examining “what if” scenarios within the data. Power BI reports can also answer questions in real time and help with forecasting to make sure departments meet business metrics.
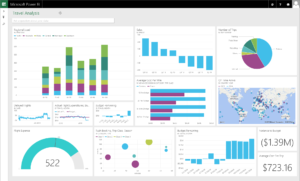
Power BI can also provide executive dashboards for administrators or managers, giving management more insight into how departments are doing.
3) Key features of Power BI
Microsoft has added a number of data analytics features to Power BI since its inception , and continues to do so. Some of the most important features include:
Artificial Intelligence – Users can access image recognition and text analytics in Power BI, create machine learning models using automated machine learning capabilities and integrate with Azure Machine Learning.
Hybrid deployment support – This feature provides built-in connectors that allow Power BI tools to connect with a number of different data sources from Microsoft, Salesforce and other vendors.
Quick Insights – This feature allows users to create subsets of data and automatically apply analytics to that information.
Common data model support – Power BI’s support for the common data model allows the use of a standardized and extensible collection of data schemas (entities, attributes and relationships).
Cortana integration – This feature, which is especially popular on mobile devices, allows users to verbally query data using natural language and access results, using Cortana, Microsoft’s digital assistant.
Customization – This feature allows developers to change the appearance of default visualization and reporting tools and import new tools into the platform.
APIs for integration – This feature provides developers with sample code and application performance interfaces (APIs) for embedding the Power BI dashboard in other software products.
Self-service data prep – Using Power Query, business analysts can ingest, transform, integrate and enrich big data into the Power BI web service. Ingested data can be shared across multiple Power BI models, reports and dashboards.
Modeling view – This allows users to divide complex data models by subject area into separate diagrams, multiselect objects and set common properties, view and modify properties in the properties pane, and set display folders for simpler consumption of complex data models.
4) Power BI components
Power BI consists of a collection of apps and can be used either on desktop, as a SaaS (Software as a Service) product or on a mobile device. Power BI Desktop is the on-premises version, Power BI Service is the cloud-based offering and mobile Power BI runs on mobile devices. The different components of Power BI are meant to let users create and share business insights in a way that fits with their role.
Included within Power BI are several components that help users create and share data reports.
- Power Query: a data mashup and transformation tool
- Power Pivot: a memory tabular data modeling tool
- Power View: a data visualization tool
- Power Map: a 3D geospatial data visualization tool
- Power Q&A: A natural language question and answering engine
Additionally, there are dozens of data sources that connect into Power BI, ranging from files (Excel, PDF, SharePoint Folder, XML), databases (SQL Server Database, Oracle Database, IBM databases, Amazon Redshift, Google BigQuery), other Power BI data sets, Azure data connections and many online services (Dynamics 365, Salesforce Reports, Google Analytics, Adobe Analytics, Facebook and others).
5) Power BI Architecture
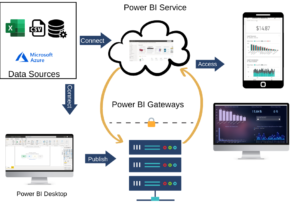 Power BI architecture is a service built on top of Azure. There are multiple data sources that Power BI can connect to. Power BI Desktop allows you to create reports and data visualizations on the dataset. Power BI gateway is connected to on-premise data sources to get continuous data for reporting and analytics. Power BI services refer to the cloud services that are used to publish Power BI reports and data visualizations. Using Power BI mobile apps, you can stay connected to their data from anywhere. Power BI apps are available for Windows, iOS, and Android platforms.
6) Power BI cost
There are three levels of Power BI for users: Power BI Desktop, Power BI Pro and Power BI Premium. The desktop version is free, while the Pro model costs $9.99 per user, per month (as of November 2018). Pricing for Power BI Premium depends on the size of the deployment and user amount.